Troubleshooting
Troubleshooting Steps
Follow these steps to effectively troubleshoot and resolve issues with the extension:
Get Started panel (recommended)
The fastest way to detect and resolve environment issues is the Get Started with dbt Power User panel. It runs through every prerequisite the extension needs — Python interpreter, dbt installation, dbt project detection, dbt deps, and database connection — and flags exactly what's missing.
Open it from the command palette:
- macOS:
Cmd + Shift + P - Windows / Linux:
Ctrl + Shift + P - Type
Get Started with dbt Power Userand run it.
You can also launch it from the Project Actions ✨ view in the dbt Power User side panel, or by clicking the dbt status item in the bottom status bar and choosing "Setup Extension".
Demo from an earlier UI
The recording below was captured before the status-bar "Setup Extension" wizard was replaced by the Get Started with dbt Power User panel. The steps are the same — only the panel UI has changed.
Detect Python from terminal
If the extension is using the wrong Python interpreter (e.g. it sees a global Python without dbt instead of your activated virtualenv), you can have it pick up the interpreter from an open terminal:
- Open a terminal in VS Code with your dbt environment activated (e.g.
source .venv/bin/activate,conda activate myenv, orpoetry shell). - Open the command palette and run
Detect Python from terminal.
The extension reads the active Python path directly from the shell and switches to it. This is the quickest fix for the most common "dbt not found" / "wrong dbt version" issues.
Requires shell integration
The command needs VS Code's terminal shell integration to read the Python path from your shell. If no terminal is open or shell integration is not active, the extension will prompt you to open one.
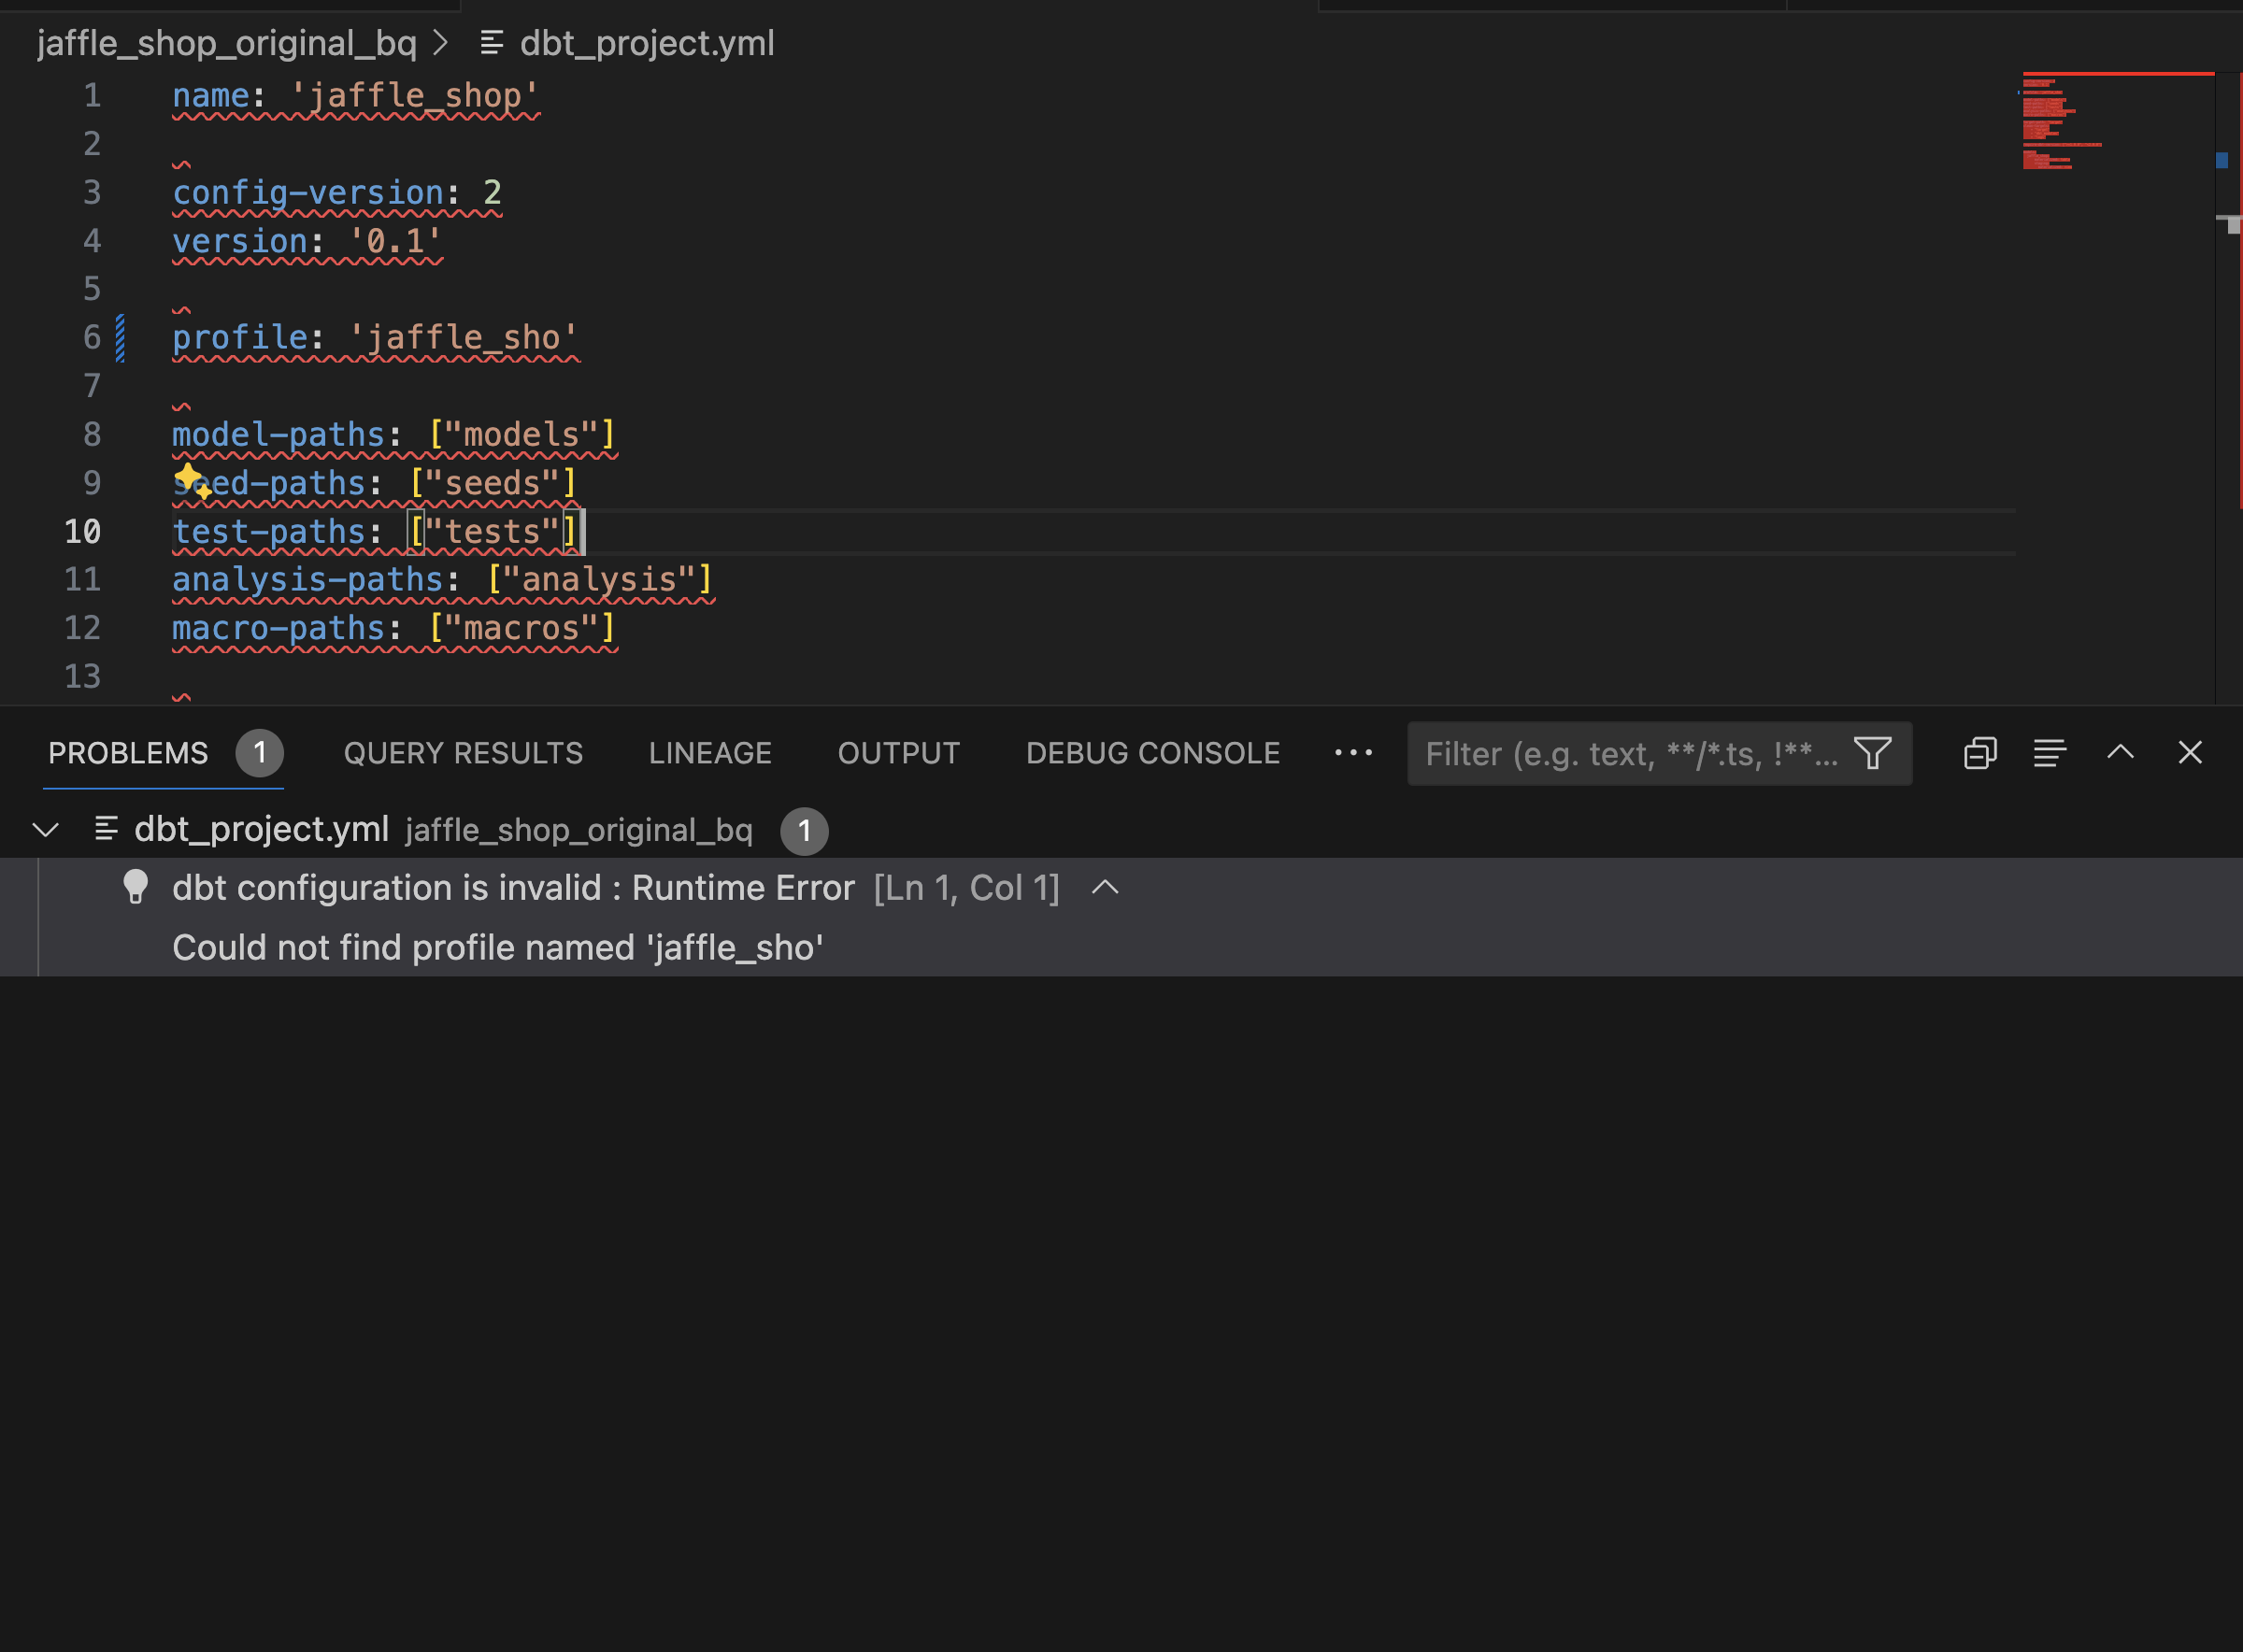
Problems Panel
Check the problems panel for any issues with your dbt project. You can access the problems panel by clicking on the Problems tab.
Diagnostics command
The diagnostics command in the VSCode Power User extension provides a comprehensive report that covers various aspects of the system and DBT project environment. Here is a summary of the diagnostics it generates:
-
Environment Variables: Lists all the environment variables which can help in understanding the system configuration and paths that might affect the DBT operations.
-
Extension Settings: Details the settings related to the VSCode extension, including preferences like AI keys, instance names, and various enabled or disabled features that influence how the extension behaves.
-
Python and DBT Installations: Confirms the installation of Python and DBT, along with their paths, ensuring that these essential tools are available and correctly set up.
-
Workspace and Project Details: Provides information about the active workspace and DBT projects, such as the version of DBT, project directory, and the first workspace path.
-
DBT Project Configuration: Outlines the configuration for the DBT project, including adapter type and version, and paths to essential files like dbt_project.yml.
-
Connection Testing: Tests and verifies the database connection, detailing the connection parameters and any errors encountered during the connection attempt.
-
Potential Issues and Errors: Identifies any issues with dependencies, such as mismatches in versions of Python libraries, and provides errors encountered during the execution of the DBT commands. Overall, the diagnostics command is designed to help users quickly assess and troubleshoot their DBT setup within VSCode by providing detailed insights into configuration, environment, and connection status.
Running the command
- On Mac, press
Cmd + Shift + Por On Windows/Linux, useCtrl + Shift + P - type diagnostics and pick the option listed under the dbt power user extension name and press enter
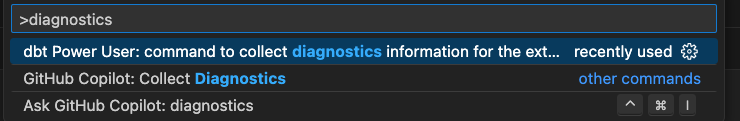
- this should start a terminal window and print the diagnostic information
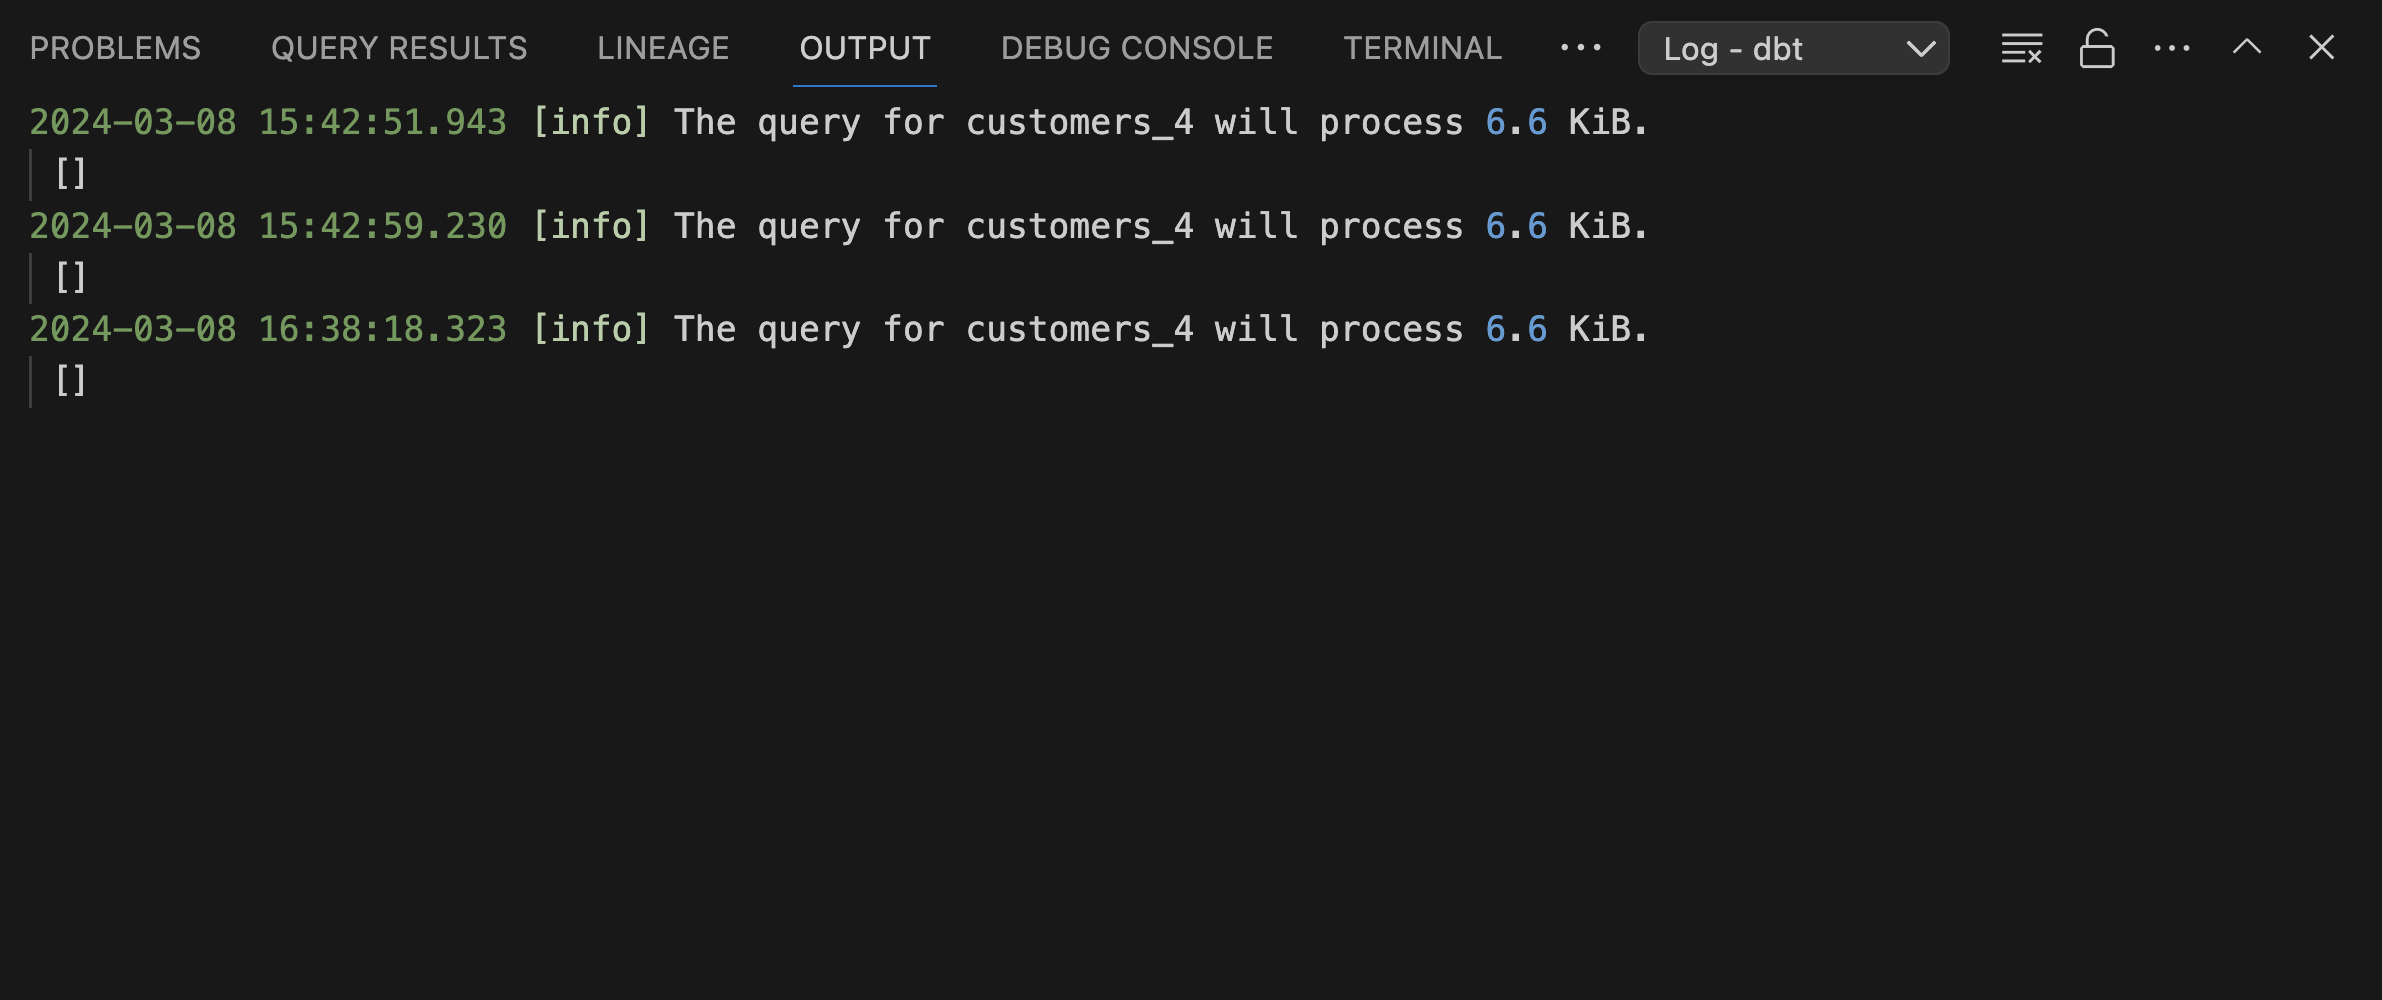
Check Extension Logs
If the problem persists, examine the logs in the IDE's output panel.
- Select
Log -> dbtfrom the dropdown menu to view detailed extension logs, which can provide insights into underlying issues. - To access more detailed logs, you can change the log level to "Debug":
- Open the vscode command palette -
- On Mac, do this by pressing
Cmd + Shift + P. - On Windows/Linux, use
Ctrl + Shift + P.
- On Mac, do this by pressing
- Once the command palette opens, type
Set Log Level, then chooseDebug. - Run the operations again and you should start seeing debug logs in the
Log -> dbtoutput stream
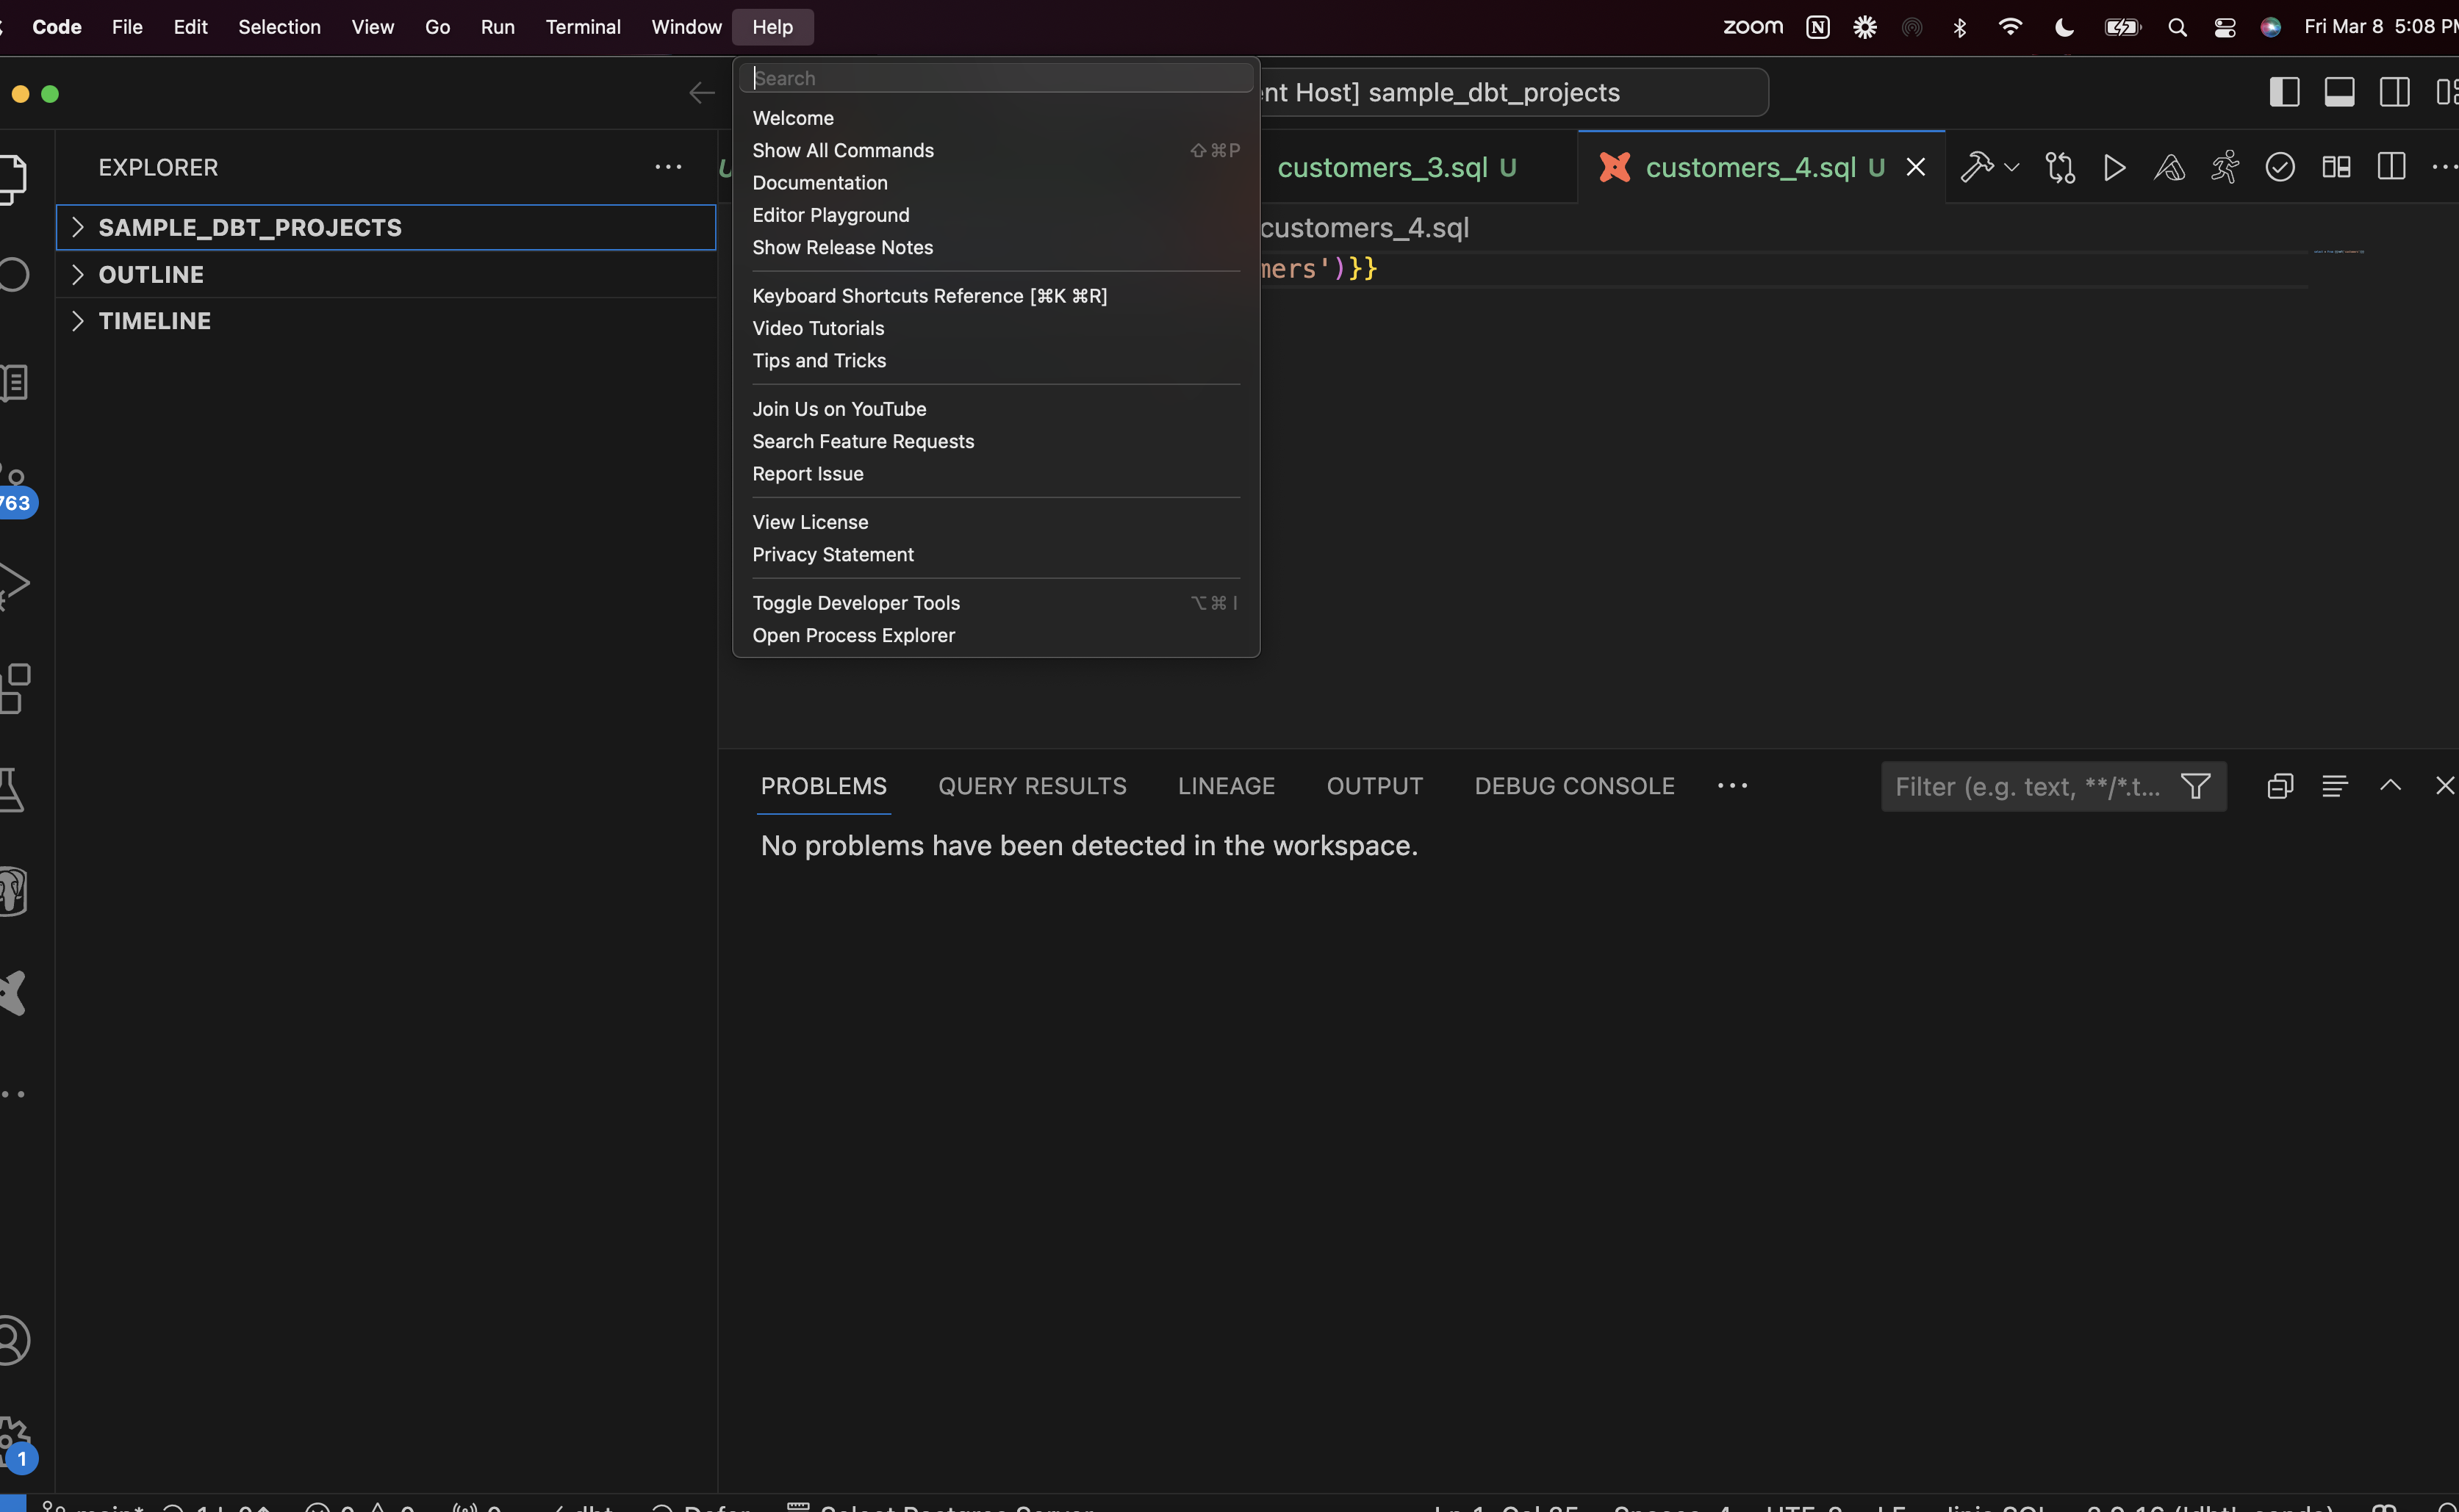
Developer Tools
For more in-depth diagnostics, use the developer tools in Visual Studio Code (VSCode). Navigate to Help -> Toggle Developer Tools to access these tools, including a console with detailed logs and error messages.
Contact Support
If issues still remain unresolved, please contact us via Slack or chat for further assistance.
Feedback Widgets
There are also feedback widgets in the extension embedded in various features, where you can directly provide feedback on the roadmap or any issues that you encountered.
Still stuck? contact us via Slack or chat